Project: Alive3d
Role: UX/UI Designer
I designed two connected panels for a SaaS product: an internal workspace for the company’s team and an external-facing panel that presents processed data to users.
My work covered information architecture, user flows, interaction design and UI, developed in close collaboration with developers. The designs were implemented and are now being further refined by a developer.
The widgets below are selected examples from the external-facing panel. The internal workspace and further project details are not shown due to confidentiality.
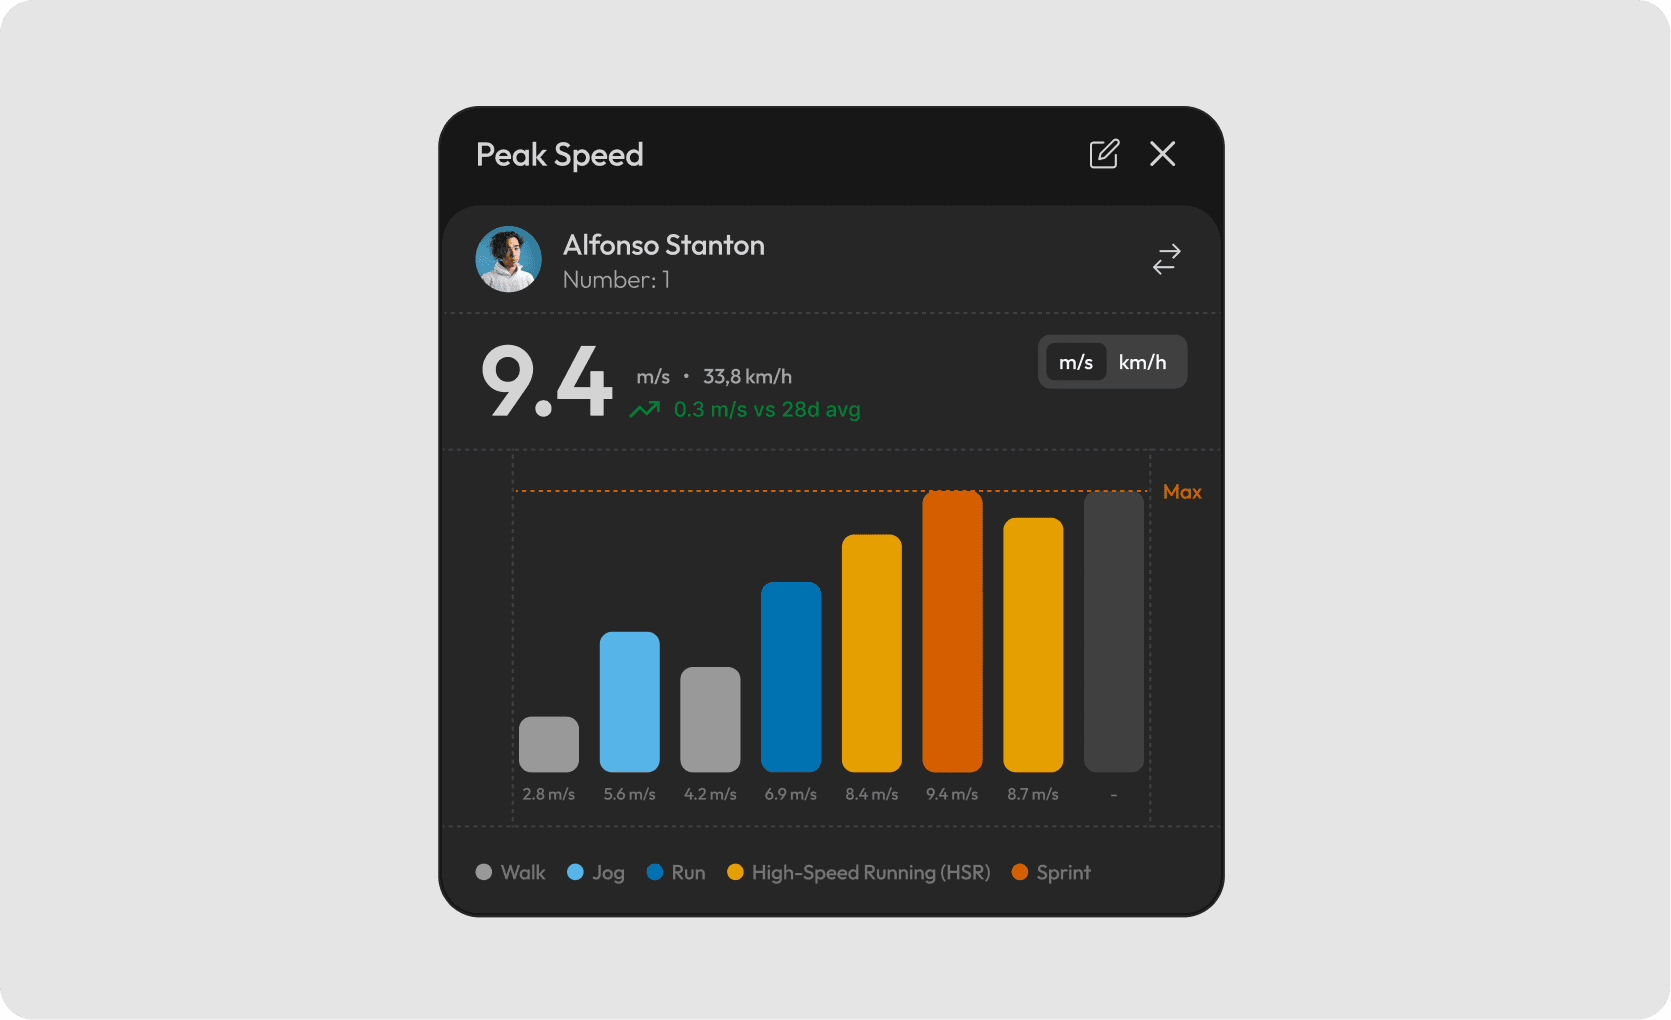
Peak speed
Individual speed summary with values shown in two units.
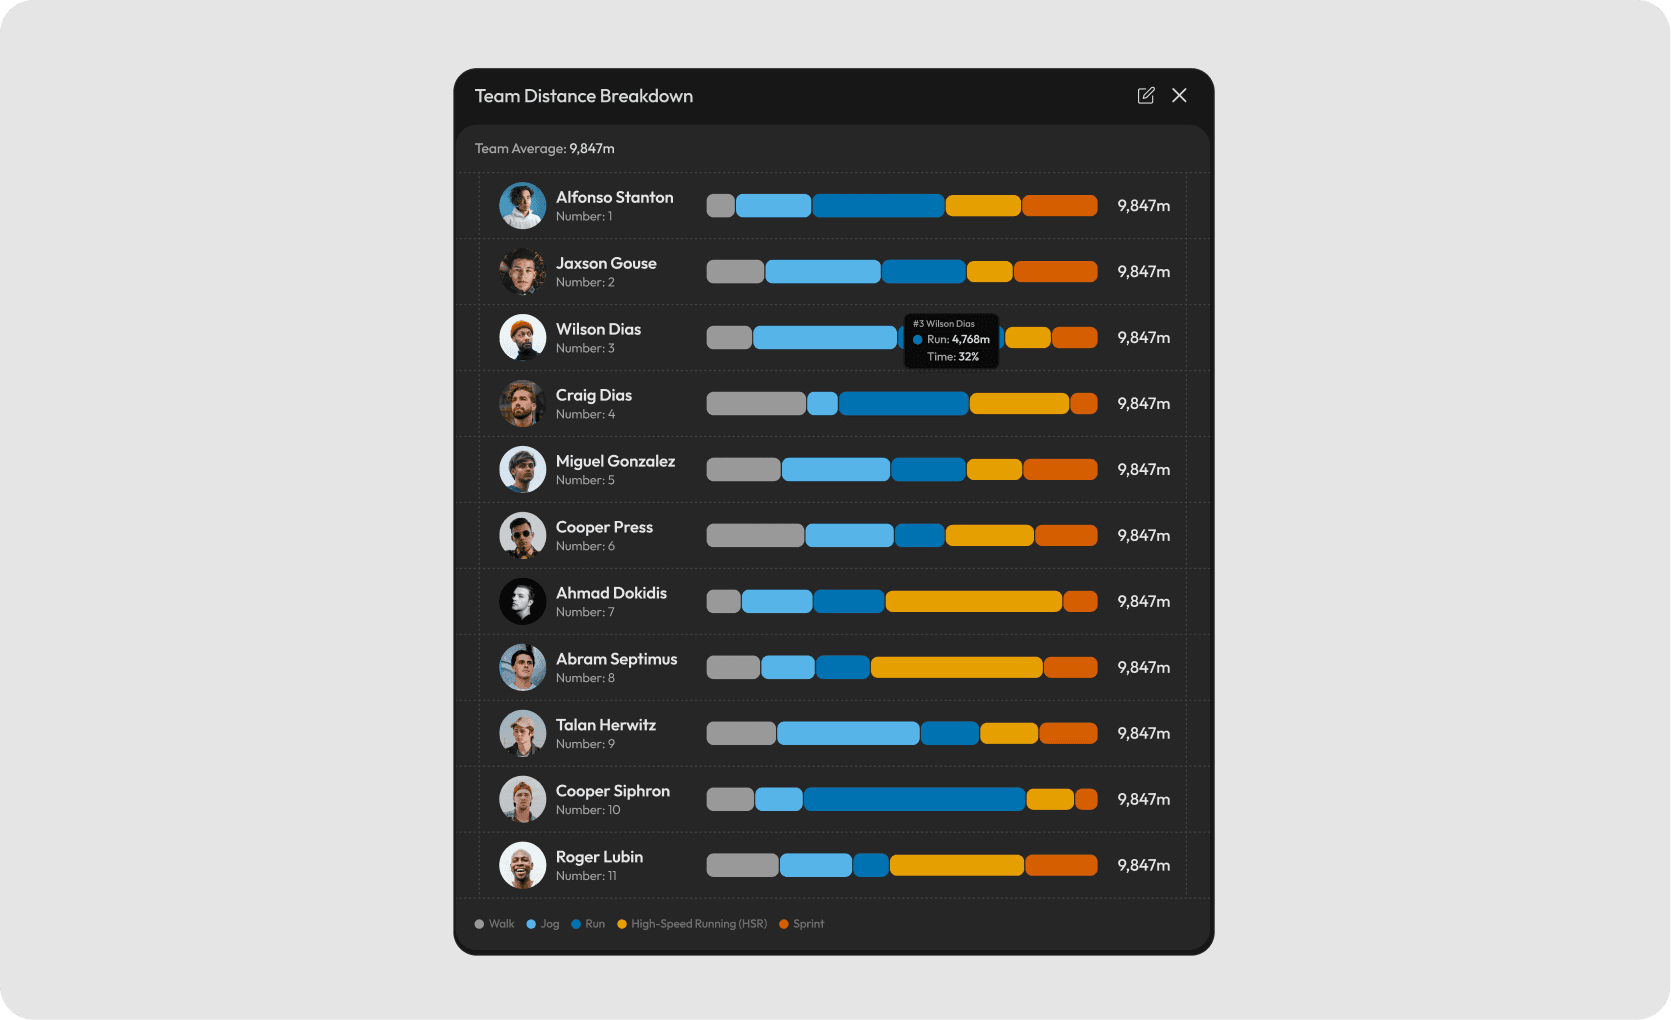
Team distance breakdown
Comparison of players’ distance across movement categories.
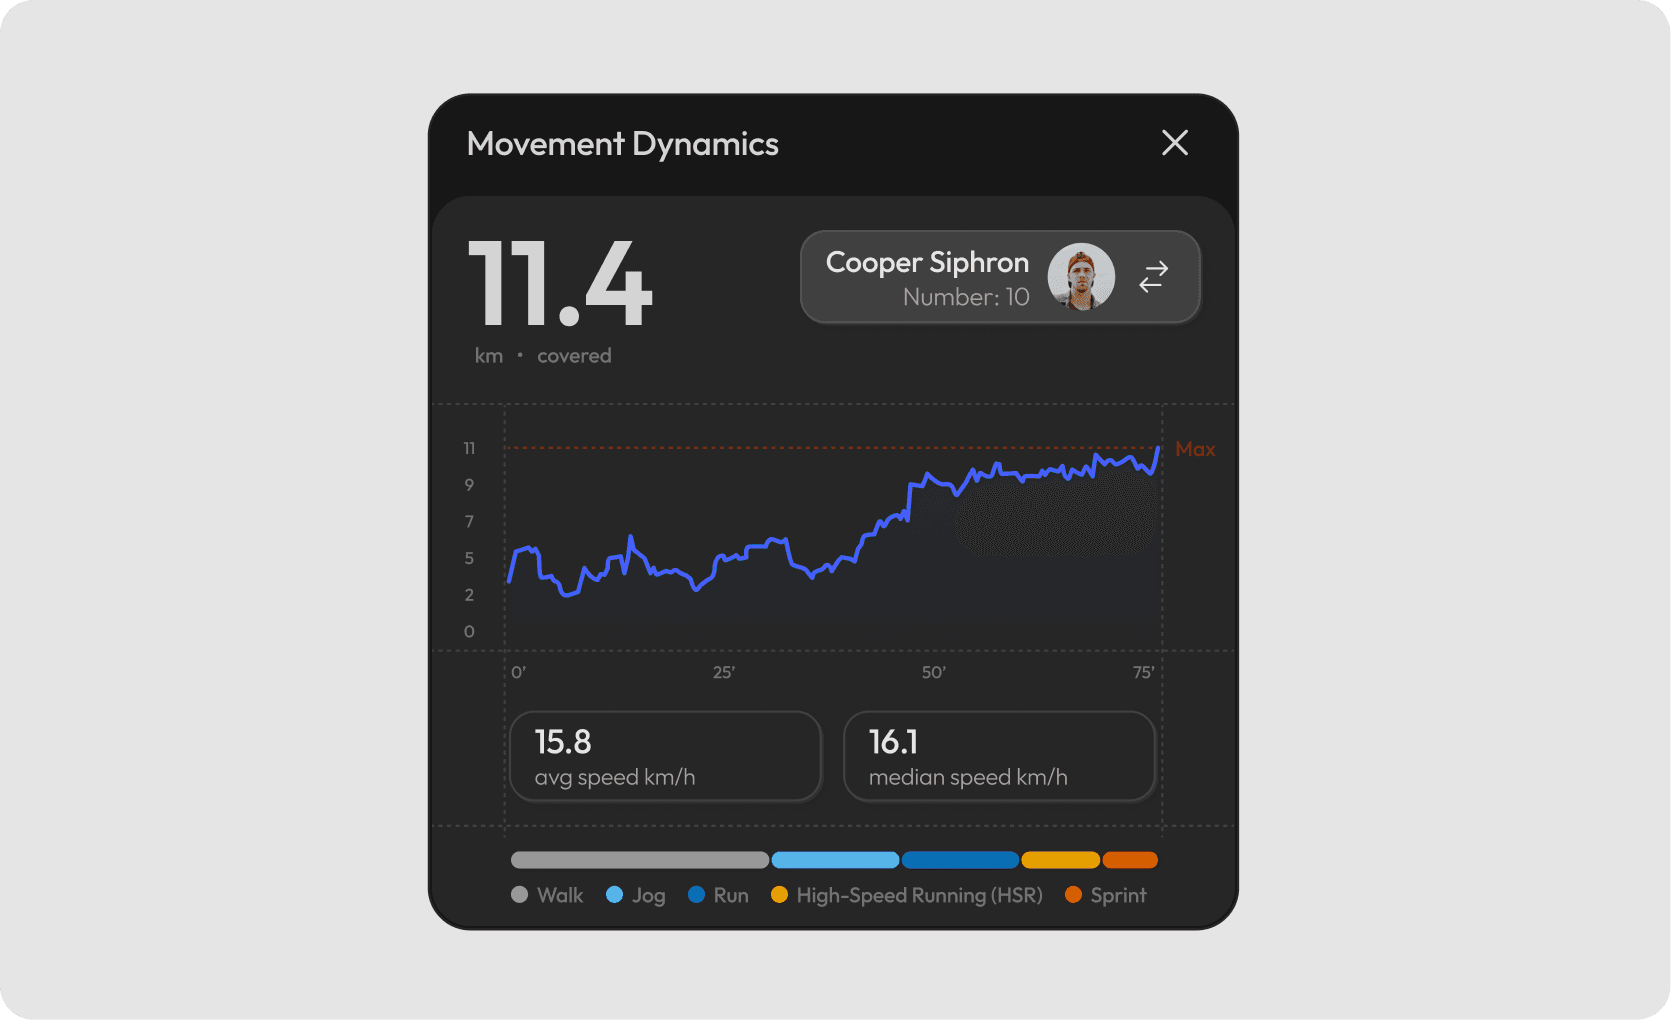
Movement dynamics
Individual performance summary with distance, speed trends and activity zones.
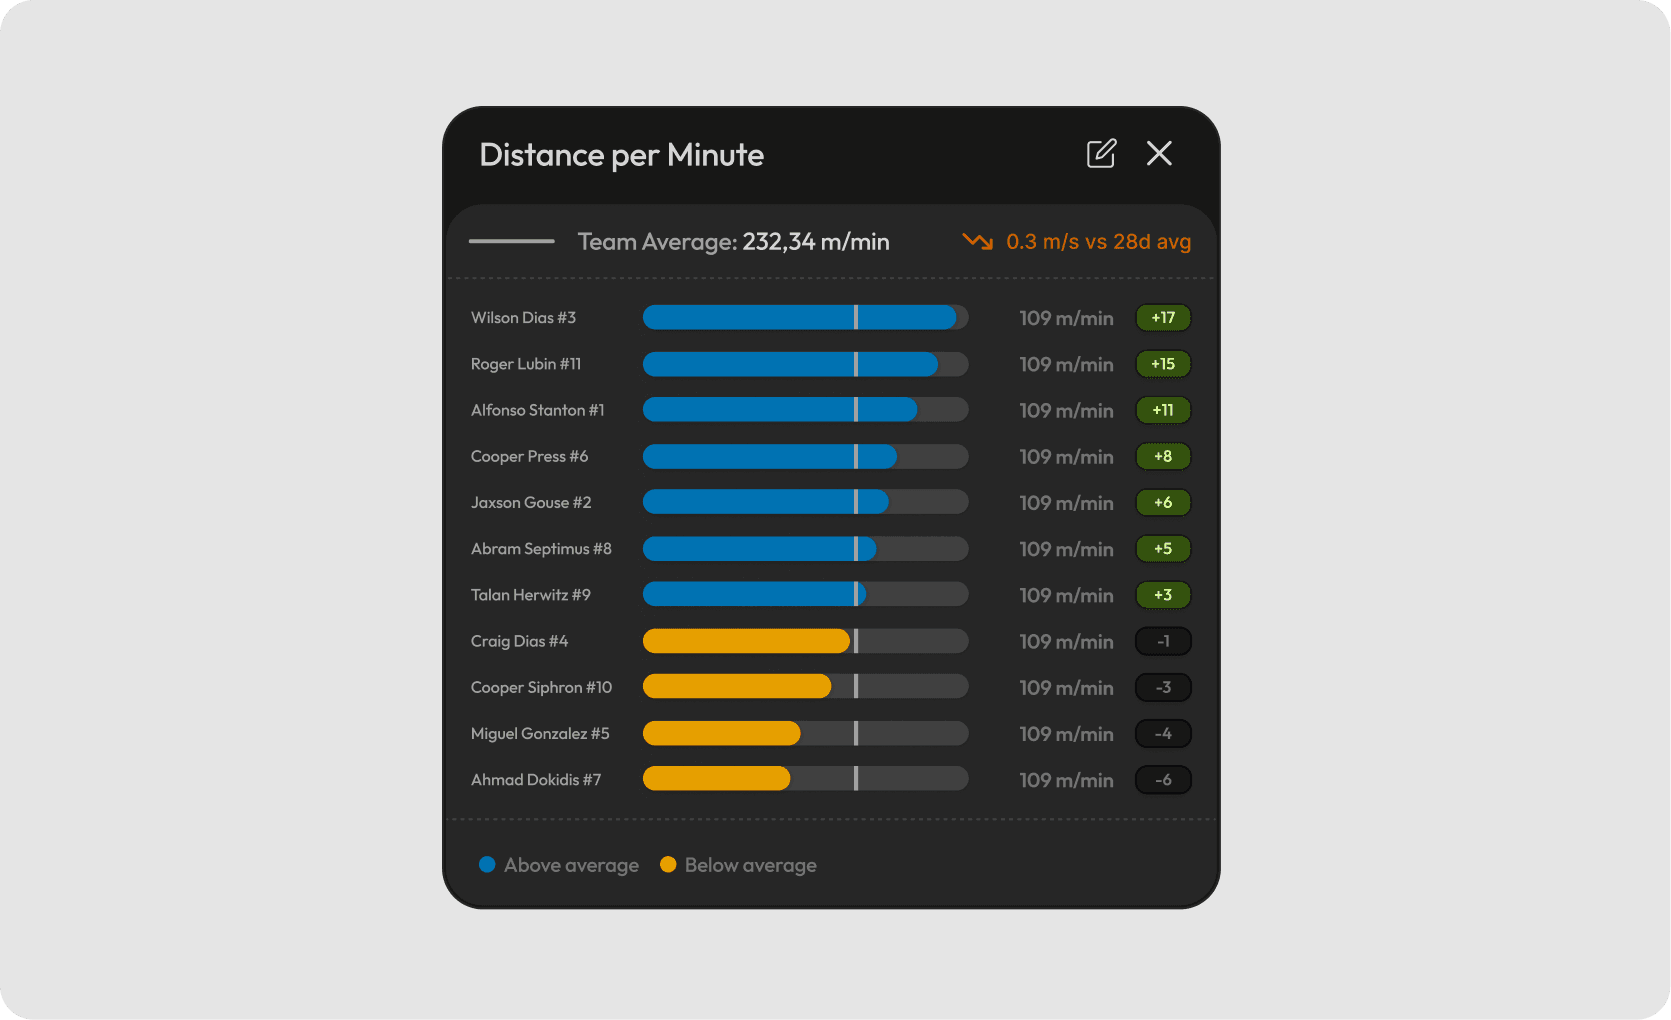
Distance per minute
Player results compared with the team average.